Enterprise Reporting User Guide
Table of Contents
What are Hierarchies?
If you have multiple merchant accounts, hierarchies allow you to group them in any way, giving you the reporting structure you desire. Take the following example:
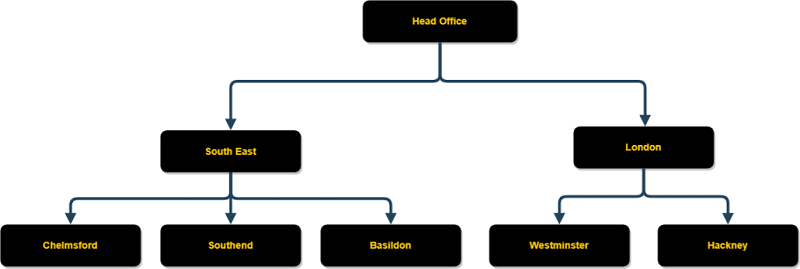
This hierarchy structure would allow you to run reports for:
- Head Office (all merchants).
- The South East (Chelmsford, Southend and Basildon).
- London (Westminster and Hackney).
- Any individual merchant.
You will see later in the user guide that each user is assigned to a position in the hierarchy, which ensures they can only see data for merchants you want them to. For example, we could give regional/area managers access to just their region and store manager access to only their store.
The Dashboard
Once you have successfully logged in, you will be greeted with your default dashboard.
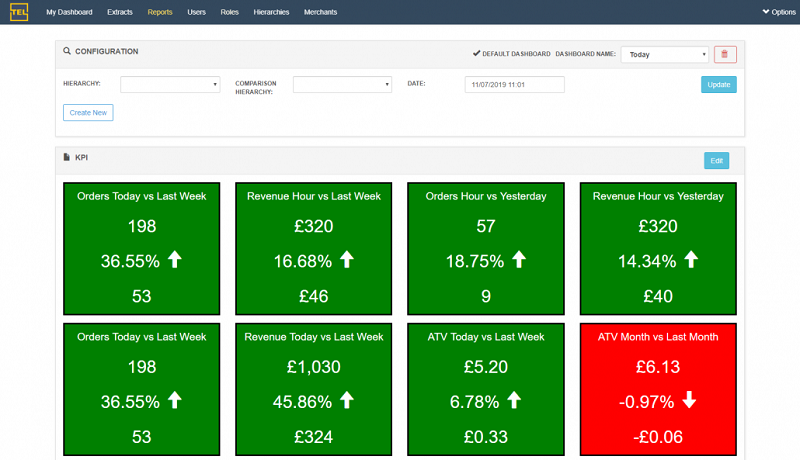
The dashboard will display real-time data for your default hierarchy (head office in this example, so all merchant data is aggregated).
The KPI indicators will compare the current values with the previous values based on the KPI configuration (shown later in the user guide).
Changing the data parameter will allow you to view these figures as at previous dates/times.
Changing the hierarchy will display data for the desired country/area/region/store.
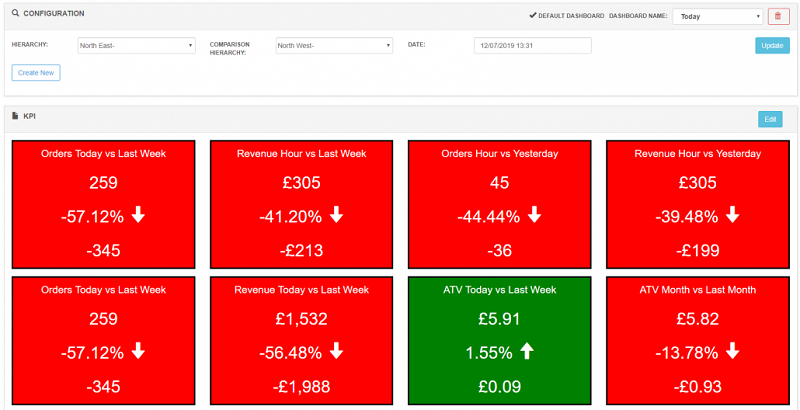
Rather than comparing the current values to previous values, you can compare two hierarchies (region A vs region B, store A vs store B etc).
When comparing two different hierarchies (for example, North East vs North West), instead of using the baseline time comparison, the dashboard will pull data from the same time period but for the comparison hierarchy.
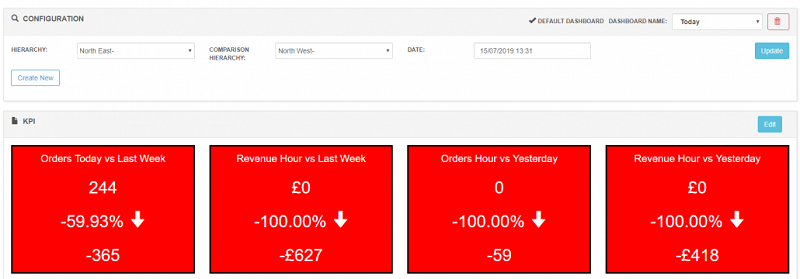
You can also change the date to compare the two hierarchies as at a point in time.
Switching Dashboards
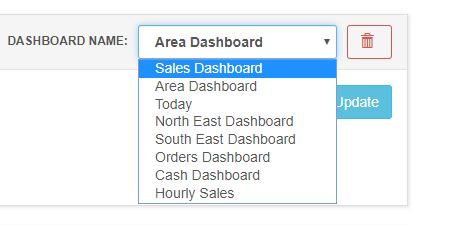
If you have access to multiple dashboards, you are able to switch between these using the Dashboard Name drop-down.
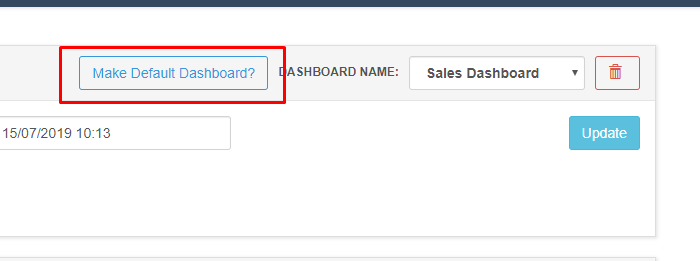
Once the dashboard has loaded, you can select Make Default Dashboard? to change your default dashboard. This will then appear every time when you login to CER.
Creating a New Dashboard
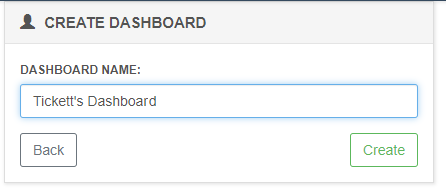
On the main dashboard screen select Create New and enter the name of your dashboard.
You can now add KPIs to your dashboard by following the steps below (Adding a KPI).
Editing a Dashboard
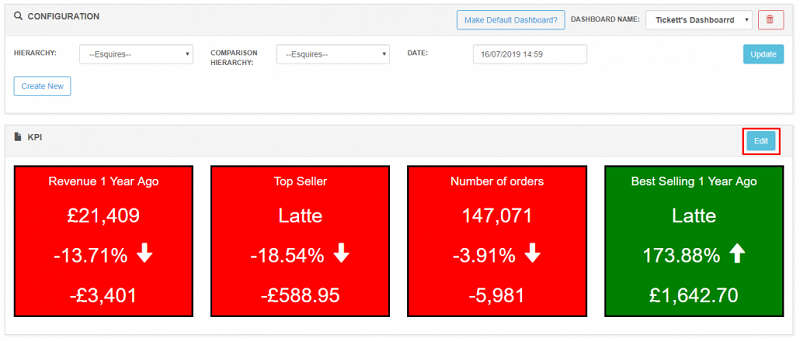
If you have the “dashboard manager” permission, you will be able to edit dashboards.
Load the dashboard you wish to modify and select Edit.
Adding a New KPI
Once you’ve followed the above on Editing a Custom Dashboard you can add a KPI by filling out a name, the type of KPI you want to pull and the time frame.
Give your KPI a name and select one of the predefined KPIs from the drop-down menu.
The window indicates the time period for which the KPI data will be collected.
The baseline indicates the time/date for which the comparison data will be collected.
So for the below example, the KPI would display Revenue today (since midnight) and compare to the Revenue on the same day one year ago.
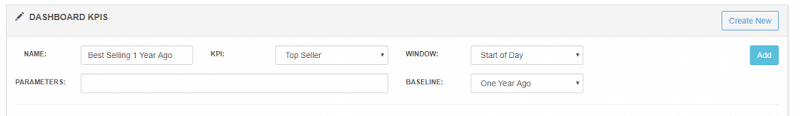
Once you’re happy with the KPI settings, select Add.
If you now return to the dashboard, you’ll see your new KPI.
Editing a KPI
Once you’ve followed the above on Editing a Dashboard you can edit a KPI by selecting the green pencil.
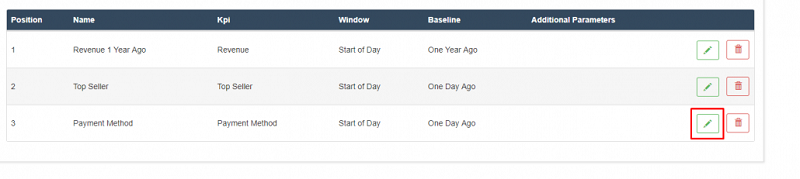
This will then enable editing functionality on that particular KPI.
Once you have finished making changes select Save.

If you now return to the dashboard, you’ll see your edited KPI.
Extracting Data
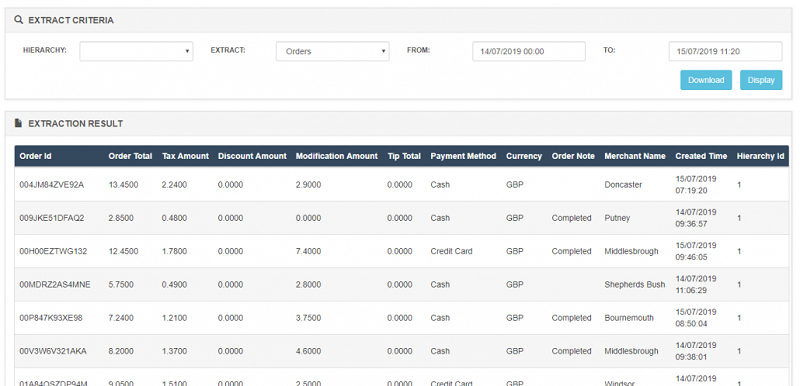
To extract ad-hoc data, go to Extract in the navigation bar and select the hierarchy (Area/Store), the type of extract and date range.
Display will display the data on-screen.
Download will download the data to a .csv which you can use for pivoting / graphing / further manipulation in Excel etc.
Running Reports
We can build reports tailored to your organisation.
Extracts should only be used to for ad-hoc data requests. If you regularly need to collate the same data (often with sorting, grouping, pivot, graphing etc) then a report should be used.
Examples of such reports may include:
- Leader Board Report (comparing store and/or regional sales over a weekly / monthly period).
- Commission Report (calculating staff commissions in a format for payroll).
- General Ledger Import (producing a file to load into your accounting system such as Xero, Sage etc).
We can schedule these reports to automatically be delivered via e-mail.
Please get in touch if you have any reporting requirements and we can provide more details.
Grouping and Hierarchies
Hierarchies makes it easy to manage the stores within regions or states.
Adding a Hierarchy
Go to Hierarchies in the Navigation Bar.
This will list all the Hierarchies you currently have setup. To add new hierarchy, go to the bottom right of the page and select Create New.
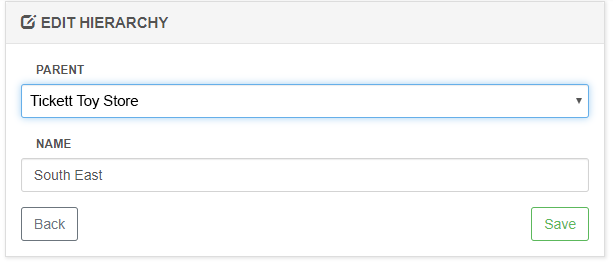
Select the parent for the Hierarchy - in this example we will be setting up a region (South East) under the main company.
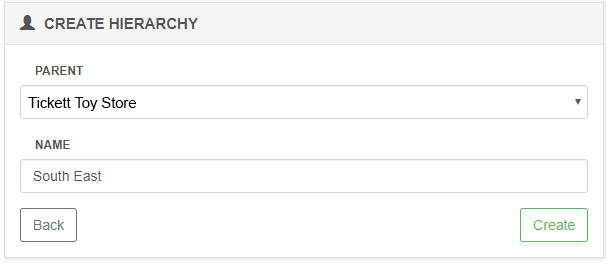
Select Create once you are finished.
Editing a Hierarchy
Go to Hierarchies in the Navigation Bar.
This will list all the Hierarchies you currently have setup. To edit an existing hierarchy, select the edit button.
You can then change the parent and name.
Users
Creating a New User
Go to the users screen by selecting Users in the navigation bar. This will list all of the current users.
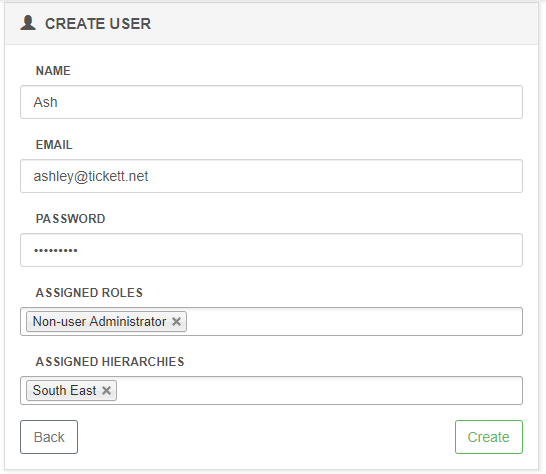
On the bottom right of the screen, select Create New
You’ll now be able to enter the user’s details such as Name, Email, Password. You’ll also be able to assign the user roles and assign them hierarchies.
Editing a User
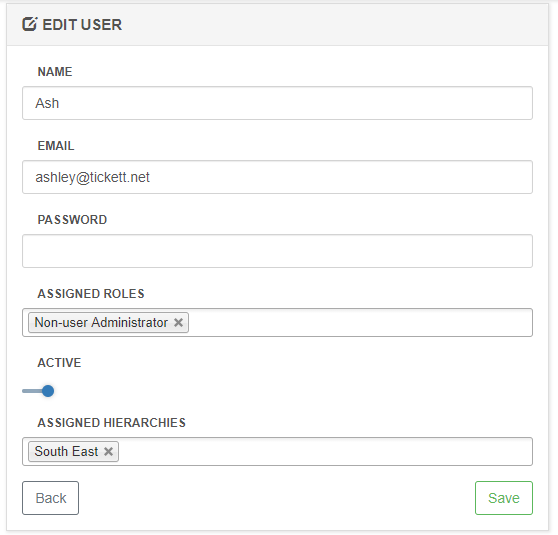
On the users screen, select Edit on the user you would like to edit.
From here you can reset the user’s password and set their account to inactivate, as well as changing the access permissions using either roles or the access to hierarchies.
Roles
Creating a Role
Navigate to the Roles page to list your current roles.
To create a new role, select Create New in the bottom right.
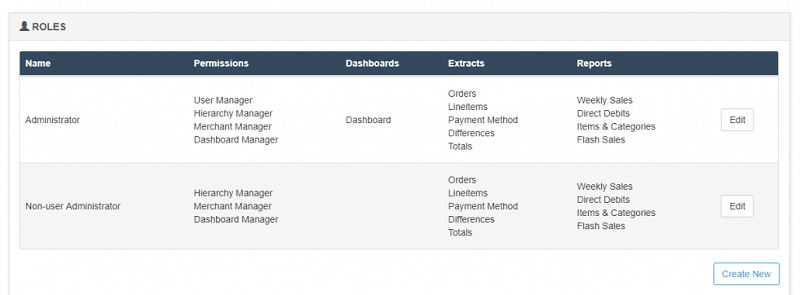
On the create screen you will be able to set the name of the role and assign Permissions, Dashboards, Extracts and Reports.
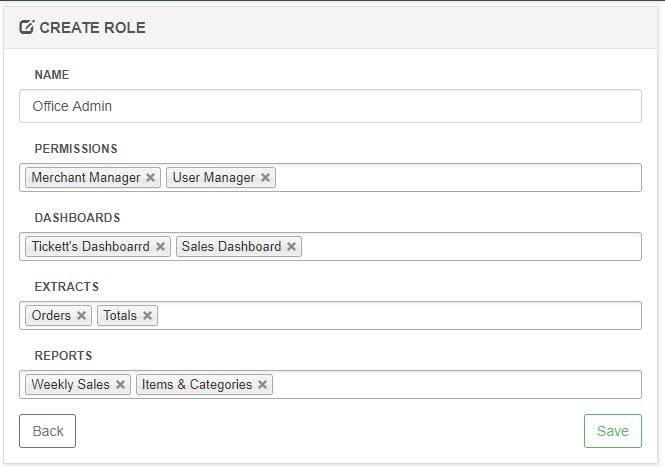
Select Save when you are finished.
Editing a Role
- Navigate to the Roles page to list your current roles.
- Select Edit next to the role you wish to change.
You can then edit the permissions, dashboard, extracts and reports by selecting the X to remove the permissions or by typing in the box to add more.
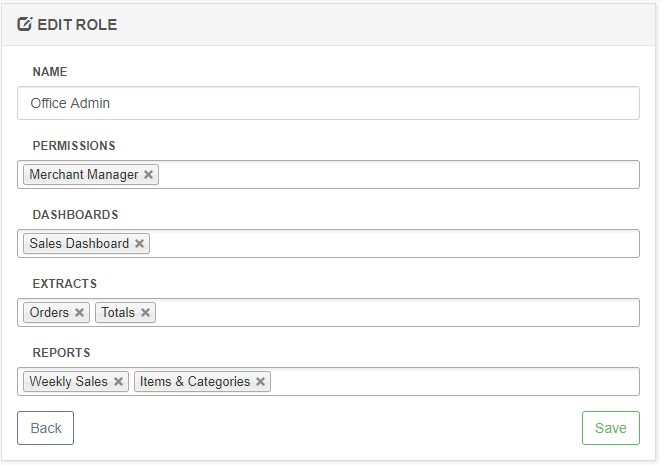
Select Save once you are finished.
Contact us with any issues/questions.